
Weather and Environmental Operations
Type of resources
Topics
Keywords
Contact for the resource
Provided by
Years
Formats
Representation types
Update frequencies
status
-
The Regional Air Quality Deterministic Prediction System FireWork (RAQDPS-FW) carries out physics and chemistry calculations, including emissions from active wildfires, to arrive at deterministic predictions of chemical species concentration of interest to air quality, such as fine particulate matter PM2.5 (2.5 micrometers in diameter or less). Geographical coverage is Canada and the United States. Data is available at a horizontal resolution of 10 km. While the system encompasses more than 80 vertical levels, data is available only for the surface level. The products are presented as historical, annual or monthly, averages which highlight long-term trends in cumulative effects on the environment.
-
A Virtual Climate station is the result of threading together climate data from proximate current and historical stations to construct a long term threaded data set. For the purpose of identifying and tabulating daily extremes of record for temperature, precipitation and snowfall, the Meteorological Service of Canada has threaded or put together data from closely related stations to compile a long time series of data for about 750 locations in Canada to monitor for record-breaking weather. The length of the time series of virtual stations is often greater than 100 years. A Virtual Climate station is always named for an “Area” rather than a point, e.g. Winnipeg Area, to indicate that the data are drawn from that area (within a 20km radius from the urban center) rather than a single precise location.
-
Anomalous weather resulting in Temperature and Precipitation extremes occurs almost every day somewhere in Canada. For the purpose of identifying and tabulating daily extremes of record for temperature, precipitation and snowfall, the Meteorological Service of Canada has threaded or put together data from closely related stations to compile a long time series of data for about 750 locations in Canada to monitor for record-breaking weather. Virtual Climate stations correspond with the city pages of weather.gc.ca. This data provides the daily extremes of record for Snowfall for each day of the year. Daily elements include: Greatest Snowfall.
-
Anomalous weather resulting in Temperature and Precipitation extremes occurs almost every day somewhere in Canada. For the purpose of identifying and tabulating daily extremes of record for temperature, precipitation and snowfall, the Meteorological Service of Canada has threaded or put together data from closely related stations to compile a long time series of data for about 750 locations in Canada to monitor for record-breaking weather. Virtual Climate stations correspond with the city pages of weather.gc.ca. This data provides the daily extremes of record for Temperature for each day of the year. Daily elements include: High Maximum, Low Maximum, High Minimum, Low Minimum.
-
Climate observations are derived from two sources of data. The first are Daily Climate Stations producing one or two observations per day of temperature, precipitation. The second are hourly stations that typically produce more weather elements e.g. wind or snow on ground.
-
Anomalous weather resulting in Temperature and Precipitation extremes occurs almost every day somewhere in Canada. For the purpose of identifying and tabulating daily extremes of record for temperature, precipitation and snowfall, the Meteorological Service of Canada has threaded or put together data from closely related stations to compile a long time series of data for about 750 locations in Canada to monitor for record-breaking weather. Virtual Climate stations correspond with the city pages of weather.gc.ca. This data provides the daily extremes of record for Precipitation for each day of the year. Daily elements include: Greatest Precipitation.
-
The PRECIP-ET (PRECIPET on images) is an extension of the PRECIP product (hence the use of ET in the product name). Compared to the previous PRECIP product, the PRECIP-ET performs a suite of additional quality control (QC) tests and tracks issues better. For example, Doppler filters might be rejecting moderate ground echoes in a particular area and thus weak meteorological echoes would not be detectible. In this case, PRECIP-ET would flag the missing data area, whereas PRECIP would simply treat the area as no echoes. This additional quality treatment is why we have migrated to PRECIP-ET in 2013, to get an improved service. The PRECIP-ET image is designed to show the precipitation close to the ground, by using Doppler technology processing for echoes within 128 km from the radar site for the C-Band radars and 240 km for the new S-Band radars. Doppler technology allows for better resolution of the precipitation echoes and also provides the ability to detect the movement of precipitation in relation to the radar (i.e. are the raindrops or snowflakes moving towards or away from the radar and at what speed). Beyond this 128 km limit, the echoes are displayed using the more conventional CAPPI processing.
-
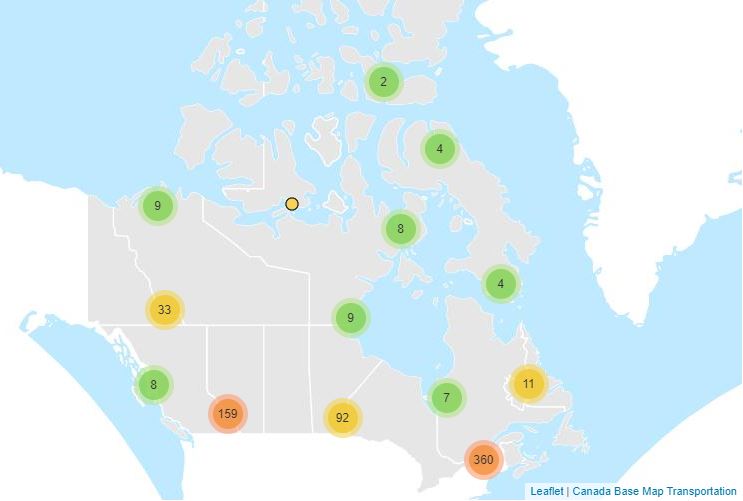
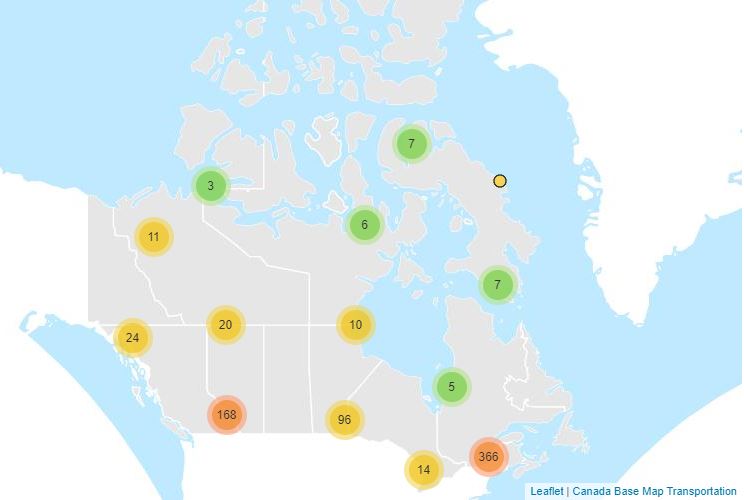
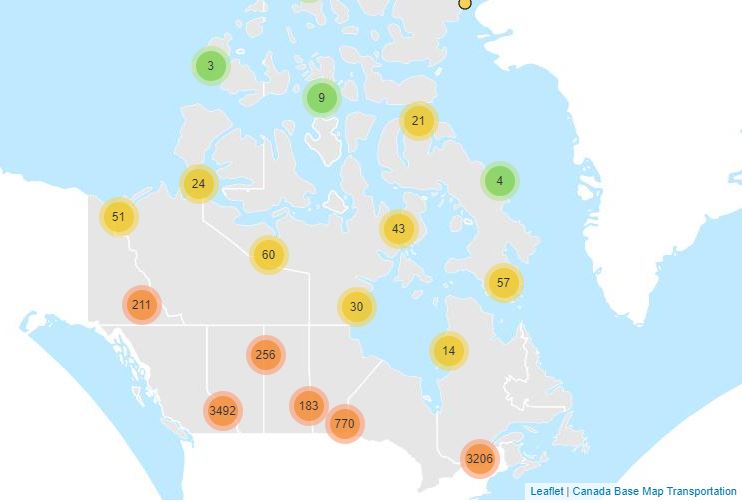
A station is a site on a river or lake where water quantity (water level and flow) are collected and recorded.
-
WCPS-coupled forecast is the component in the Water Cycle Prediction System (WCPS) that provides the coupled atmosphere-ocean-sea ice forecasts at a 1km resolution (0.008 x 0.008 degree) over the Great Lakes, St. Lawrence River and the Gulf of St. Lawrence. It launches 4 times a day at 00, 06, 12, and 18 UTC and produces 84 hours forecast, based on the atmospheric model GEM, coupled with the ocean-ice model NEMO-CICE. The products from WCPS-coupled forecasts are (1) GEM : surface air temperatures, surface wind velocities, and surface runoff (2) NEMO-CICE : variety of lake/ocean sea ice variables, for example, lake levels and temperatures. They are designed to help forecasters issuing bulletins and warnings in ice-infestested waters for navigation, water level alert, emergency response, Search and Rescue, and CIS Sea Ice forecast.
-
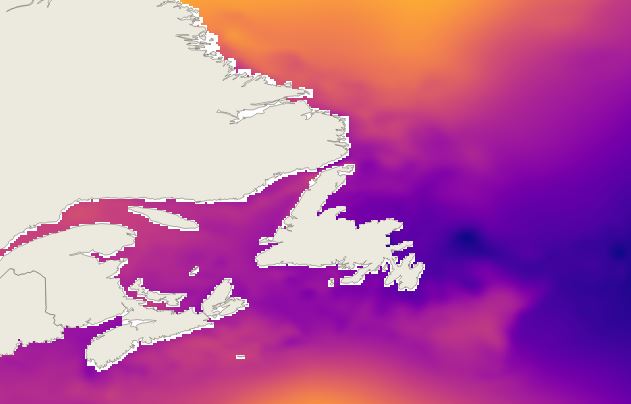
The Regional Ensemble storm Surge Prediction System (RESPS) produces storm surge forecasts using the DalCoast ocean model. DalCoast (Bernier and Thompson 2015) is a storm surge forecast system for the east coast of Canada based on the depth-integrated, barotropic and linearized form of the Princeton Ocean Model. The model is forced by the 10 meters winds and sea level pressure from the Global Ensemble Prediction System (GEPS).